
The Semiconductor DCF: What NVDA, TSM, and AMD Are Actually Worth
A full discounted cash flow valuation of the three AI semiconductor leaders. WACC derivation, 5-year projections, sensitivity analysis, reverse DCF, and peer multiples. Every assumption stated. Every number challengeable.
Our previous post described the semiconductor correction — what happened, how the selloff bifurcated, what the charts say. Several readers correctly noted that describing events is not the same as analyzing value. This post corrects that.
What follows is a proper valuation exercise for the three semiconductor companies that matter most to the AI investment thesis: Nvidia (NVDA), TSMC (TSM), and AMD. We build a 10-year discounted cash flow model for each, derive WACC from CAPM using multiple beta benchmarks, run sensitivity analysis, reverse-engineer what the market is pricing, and cross-check using forward peer multiples. We then weight both approaches to arrive at target prices.
Every assumption is stated. Every number can be challenged. The full model is published — not "available on request."
Methodology
We use the two standard valuation frameworks:
1. Income Approach (DCF). Project revenue top-down from addressable market assumptions, apply margin forecasts to arrive at operating income, build a free cash flow statement (NOPAT + D&A − CapEx − ΔWC), discount at WACC, add terminal value, subtract net debt, divide by shares.
2. Market Approach (Forward Multiples). Apply growth-adjusted forward P/E to each company's consensus forward EPS, cross-referenced with EV/EBITDA and EV/Revenue multiples against a justified peer group.
Both approaches have weaknesses. The DCF is hypersensitive to the discount rate and terminal assumptions. The market approach assumes the peer group is properly priced, which may not be true if the entire sector is rich. We address both concerns explicitly below.
We weight the income approach at 60% and the market approach at 40%. This is subjective — as all weighting is. We lean toward the DCF because it forces explicit assumptions, but give meaningful weight to multiples because markets can stay irrational longer than DCF models can stay right.
WACC Derivation: The Beta Question
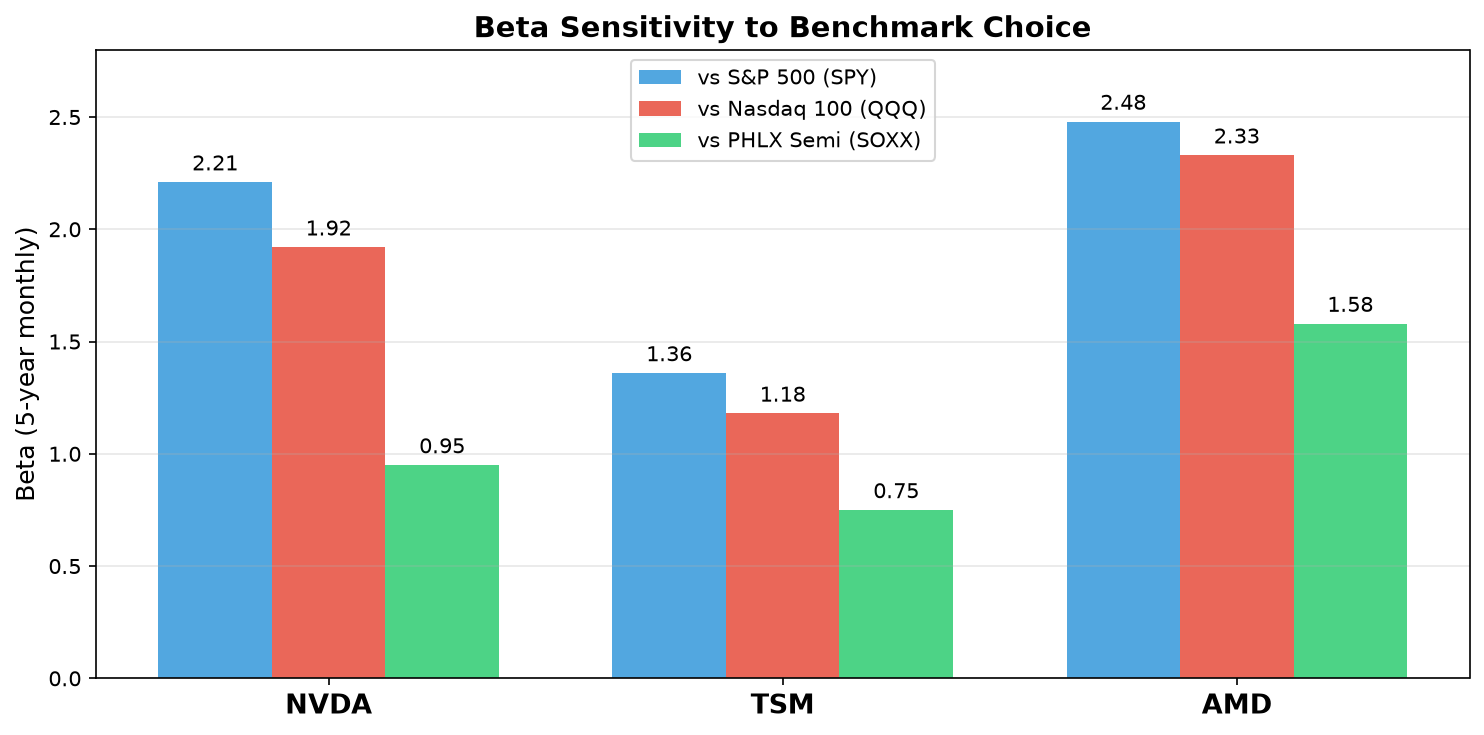
All three companies have minimal debt, so WACC is almost entirely driven by the cost of equity. The cost of equity depends on beta — and beta depends on which benchmark you regress against.
| Parameter | NVDA | TSM | AMD |
|---|---|---|---|
| Risk-free rate (10Y UST, Jul 2) | 4.37% | 4.37% | 4.37% |
| Equity Risk Premium (Damodaran) | 5.0% | 5.0% | 5.0% |
| Beta vs. S&P 500 (SPY) | 2.21 | 1.36 | 2.48 |
| Beta vs. Nasdaq 100 (QQQ) | 1.92 | 1.18 | 2.33 |
| Beta vs. PHLX Semiconductor (SOXX) | 0.95 | 0.75 | 1.58 |
| Cost of Equity (CAPM, SPY β) | 15.4% | 11.2% | 16.7% |
| Cost of Equity (CAPM, QQQ β) | 14.0% | 10.3% | 16.0% |
| After-tax Cost of Debt | 1.6% | 2.9% | 2.8% |
| Debt / Total Cap | 0.3% | 1.5% | 0.5% |
| WACC (SPY β, base case) | 15.4% | 11.2% | 16.7% |
Which benchmark is correct? There is no single right answer, but the choice matters — it moves WACC by 1-2 percentage points, which compounds dramatically over a 10-year forecast.
S&P 500 (SPY) is the academic standard. It represents the total investable US equity market. CAPM theory says beta should be measured against the market portfolio, and the S&P 500 is the closest practical proxy. This produces the highest betas.
Nasdaq 100 (QQQ) is a narrower benchmark dominated by technology. Regressing semiconductor stocks against a tech-heavy index mechanically lowers beta because the benchmark itself is volatile and correlated. The R-squared improves significantly: NVDA's R² rises from 0.48 (vs. SPY) to 0.63 (vs. QQQ), meaning QQQ explains more of NVDA's variance. This is arguably the better benchmark if your portfolio is tech-concentrated.
PHLX Semiconductor (SOXX) is the sector index. It produces dramatically lower betas (NVDA at 0.95!) because you're regressing semiconductor stocks against other semiconductor stocks. This is the wrong benchmark for cost-of-equity purposes — it tells you how volatile a stock is relative to its sector, not relative to the broad market. But it's useful for understanding idiosyncratic vs. sector risk.
Our choice: We use the S&P 500 beta as the base case because it aligns with CAPM theory and conservative valuation practice. We show the QQQ-beta scenario in the sensitivity analysis as a "lower WACC" case. The difference is material: NVDA's fair value shifts from $43 (SPY beta) to $48 (QQQ beta) on the same cash flows.
Why We Extended to 10 Years
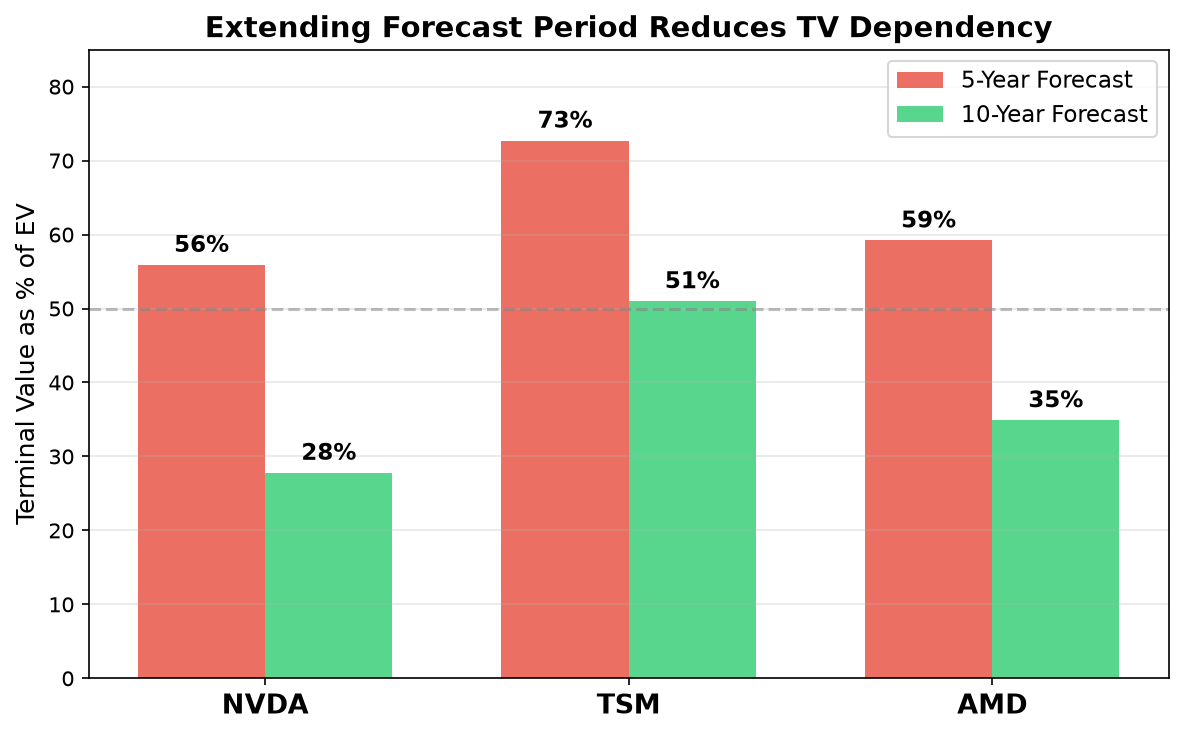
Our original 5-year DCF produced terminal values representing 57-73% of enterprise value — meaning the valuation depended more on what happens after Year 5 than on any explicit forecast. This is a legitimate and serious flaw.
The fix is to extend the forecast period until revenue growth has decelerated to roughly the terminal growth rate. At that point, the Gordon Growth assumption (constant growth forever) becomes defensible because you're no longer assuming a sharp cliff between the forecast period and perpetuity.
With a 10-year forecast, revenue growth decelerates from ~20-26% in Year 1 to 2-3% by Year 10 — close to the 2.5% terminal growth assumption. This compresses terminal value's share of EV dramatically:
| Company | 5-Year TV % of EV | 10-Year TV % of EV | Improvement |
|---|---|---|---|
| NVDA | 56% | 28% | −28 pp |
| TSM | 73% | 48% | −25 pp |
| AMD | 59% | 35% | −24 pp |
For NVDA and AMD, the terminal value is now under 35% of EV — a much more defensible model structure. TSM remains at 48% because its near-term FCF is suppressed by enormous capex ($38-48B/year), pushing more weight to the terminal period. That's an honest reflection of TSMC's economics: it reinvests heavily today to generate cash tomorrow.
The CapEx Correction
A sharp-eyed reader correctly challenged our original NVDA capex projections as unrealistically low. The original model had capex growing from $8B to $14B over five years — against EBITDA of $162B to $217B. That implies capex/EBITDA of just 5-7%, which is unsustainably low for a company facing intensifying competition.
Here's why capex must be higher: NVDA's competitive moat requires continuous investment in data center infrastructure, custom packaging (CoWoS), software platform development, and now networking silicon (post-Mellanox). Meanwhile, AMD, Google (TPU), Amazon (Trainium), and Meta (MTIA) are all investing aggressively in custom AI silicon. If NVDA underinvests in physical and R&D infrastructure, competitors will erode its 85% market share faster than our model assumes.
Revised capex trajectory: We've increased capex from $10B (FY27) growing to $41B (FY36), with D&A rising correspondingly as the asset base expands. This reduces NVDA's FCF margin from the original 45% to a still-healthy but more realistic 30% by the end of the forecast period. Even at 30% FCF margins, NVDA remains extraordinarily profitable — Apple's FCF margin is ~25% — but the model no longer assumes capex discipline that ignores competitive reality.
NVDA: The $4.7 Trillion Question
Revenue Projection (10 Years)
Nvidia's revenue went from $27.0B (FY23) to $215.9B (FY26) — a 100% three-year CAGR. That growth was driven by capturing essentially the entire AI accelerator market. Going forward, the math changes.
| Year | AI Accelerator TAM | NVDA Share | AI Revenue | Non-AI Revenue | Total Revenue | YoY Growth |
|---|---|---|---|---|---|---|
| FY26A | ~$210B | ~87% | ~$183B | ~$33B | $216B | — |
| FY27E | $280B | 82% | $230B | $43B | $273B | +26% |
| FY28E | $360B | 78% | $281B | $46B | $327B | +20% |
| FY29E | $440B | 75% | $330B | $50B | $380B | +16% |
| FY30E | $500B | 72% | $360B | $54B | $414B | +9% |
| FY31E | $540B | 70% | $378B | $58B | $436B | +5% |
| FY32E | $575B | 68% | $391B | $62B | $453B | +4% |
| FY33E | $605B | 66% | $399B | $68B | $467B | +3% |
| FY34E | $630B | 65% | $410B | $69B | $479B | +2.6% |
| FY35E | $650B | 64% | $416B | $74B | $490B | +2.3% |
| FY36E | $670B | 63% | $422B | $77B | $499B | +1.8% |
Key assumptions:
• TAM growth decelerates from ~40% to ~3% as the initial AI infrastructure buildout matures.
• Market share declines from ~85% to ~63% as AMD's MI350/MI400 series ramps and hyperscalers deploy custom silicon.
• Non-AI revenue (gaming, professional visualization, automotive, networking) grows at ~8%, reaching $77B.
Margin and FCF Projection (Revised CapEx)
| ($ Billions) | FY27E | FY28E | FY29E | FY30E | FY31E | FY32E | FY33E | FY34E | FY35E | FY36E |
|---|---|---|---|---|---|---|---|---|---|---|
| Revenue | 273 | 327 | 380 | 414 | 436 | 453 | 467 | 479 | 490 | 499 |
| Op Margin | 58% | 55% | 52% | 50% | 48% | 46% | 44% | 43% | 42% | 41% |
| EBIT | 158 | 180 | 198 | 207 | 209 | 208 | 205 | 206 | 206 | 205 |
| EBITDA | 162 | 185 | 204 | 214 | 217 | 218 | 217 | 220 | 222 | 223 |
| NOPAT (18% tax) | 130 | 147 | 162 | 170 | 172 | 171 | 168 | 169 | 169 | 168 |
| + D&A | 4 | 5 | 6 | 7 | 8 | 10 | 12 | 14 | 16 | 18 |
| − CapEx | -10 | -14 | -18 | -22 | -26 | -30 | -34 | -37 | -39 | -41 |
| − ΔWC | -2 | -2 | -3 | -2 | -2 | -2 | -1 | -1 | -1 | -1 |
| FCF | 126 | 140 | 153 | 157 | 156 | 153 | 147 | 147 | 147 | 146 |
| FCF Margin | 46% | 43% | 40% | 38% | 36% | 34% | 31% | 31% | 30% | 29% |
Margin compression from 58% to 41% operating reflects three forces: (1) increasing competition compressing pricing power, (2) mix shift toward lower-margin non-AI segments as AI growth decelerates, (3) rising R&D intensity as the product portfolio broadens. Capex rises from $10B to $41B as NVDA invests in infrastructure to defend its competitive position — a direct response to the critique that $14B capex against $217B EBITDA was unrealistically low.
DCF Result (10-Year)
WACC: 15.4% (SPY beta) | Terminal growth: 2.5%
| Component | Value |
|---|---|
| Sum of PV(FCF), 10 years | $719B |
| Terminal Value (Gordon Growth) | $1,158B |
| PV of Terminal Value | $277B |
| Enterprise Value | $996B |
| (−) Net Debt | −$40B (net cash) |
| Equity Value | $1,036B |
| ÷ Shares | 24.22B |
| Fair Value per Share | $43 |
Terminal value is now only 28% of EV — down from 57% in the 5-year model. This is the structural improvement from extending the forecast period: the valuation depends less on perpetuity assumptions and more on explicitly modeled cash flows.
TSM: The Capital-Intensive Foundry
TSMC's economics differ fundamentally from NVDA. It is a manufacturer, not a designer. Its capital intensity is enormous — $38-48B in annual CapEx — which means its FCF conversion is much lower despite high margins.
10-Year FCF Projection
| ($ Billions) | 2026E | 2027E | 2028E | 2029E | 2030E | 2031E | 2032E | 2033E | 2034E | 2035E |
|---|---|---|---|---|---|---|---|---|---|---|
| Revenue | 145 | 168 | 185 | 198 | 210 | 222 | 232 | 241 | 249 | 256 |
| Op Margin | 52% | 50% | 48% | 47% | 46% | 45% | 44% | 44% | 43% | 43% |
| EBITDA | 90 | 101 | 108 | 114 | 120 | 125 | 129 | 135 | 137 | 142 |
| NOPAT | 60 | 67 | 71 | 74 | 77 | 80 | 82 | 85 | 86 | 88 |
| + D&A | 15 | 17 | 19 | 21 | 23 | 25 | 27 | 29 | 30 | 32 |
| − CapEx | -38 | -42 | -42 | -40 | -38 | -42 | -46 | -48 | -48 | -46 |
| FCF | 40 | 45 | 50 | 57 | 64 | 64 | 64 | 67 | 69 | 75 |
| FCF Margin | 28% | 27% | 27% | 29% | 30% | 29% | 27% | 28% | 28% | 29% |
The CapEx line is the story. TSMC must reinvest nearly all of its D&A and then some just to maintain its technology lead. FCF margin of 27-30% is healthy but a fraction of NVDA's 29-46%.
WACC: 11.2% (SPY beta) | Terminal growth: 2.5%
| Component | Value |
|---|---|
| Sum of PV(FCF) | $329B |
| PV of Terminal Value | $306B |
| Enterprise Value | $635B |
| Equity Value | $670B |
| Fair Value per Share | $129 |
Terminal value is 48% of EV — still high, because TSMC's near-term FCF is suppressed by CapEx, pushing more weight to the terminal period. This is an honest reflection of foundry economics.
AMD: The Challenger Premium
AMD presents the most extreme valuation challenge. It generated $7.3B in EBITDA on $34.6B in revenue in 2025, yet commands an $844B market cap.
10-Year FCF Projection
| ($ Billions) | 2026E | 2027E | 2028E | 2029E | 2030E | 2031E | 2032E | 2033E | 2034E | 2035E |
|---|---|---|---|---|---|---|---|---|---|---|
| Revenue | 50 | 65 | 76 | 84 | 90 | 97 | 103 | 108 | 112 | 116 |
| Op Margin | 18% | 24% | 28% | 30% | 31% | 32% | 32% | 33% | 33% | 33% |
| EBITDA | 12 | 20 | 26 | 31 | 35 | 39 | 42 | 46 | 48 | 50 |
| NOPAT | 7 | 13 | 17 | 21 | 23 | 25 | 27 | 29 | 30 | 31 |
| CapEx | -4 | -6 | -8 | -10 | -11 | -12 | -13 | -14 | -15 | -15 |
| FCF | 8 | 13 | 16 | 19 | 20 | 22 | 24 | 26 | 27 | 29 |
| FCF Margin | 17% | 20% | 21% | 22% | 22% | 23% | 23% | 24% | 24% | 25% |
WACC: 16.7% | Terminal growth: 2.5%
| Component | Value |
|---|---|
| Sum of PV(FCF) | $84B |
| PV of Terminal Value | $45B |
| Enterprise Value | $129B |
| Equity Value | $134B |
| Fair Value per Share | $82 |
Sensitivity Analysis: 10-Year DCF
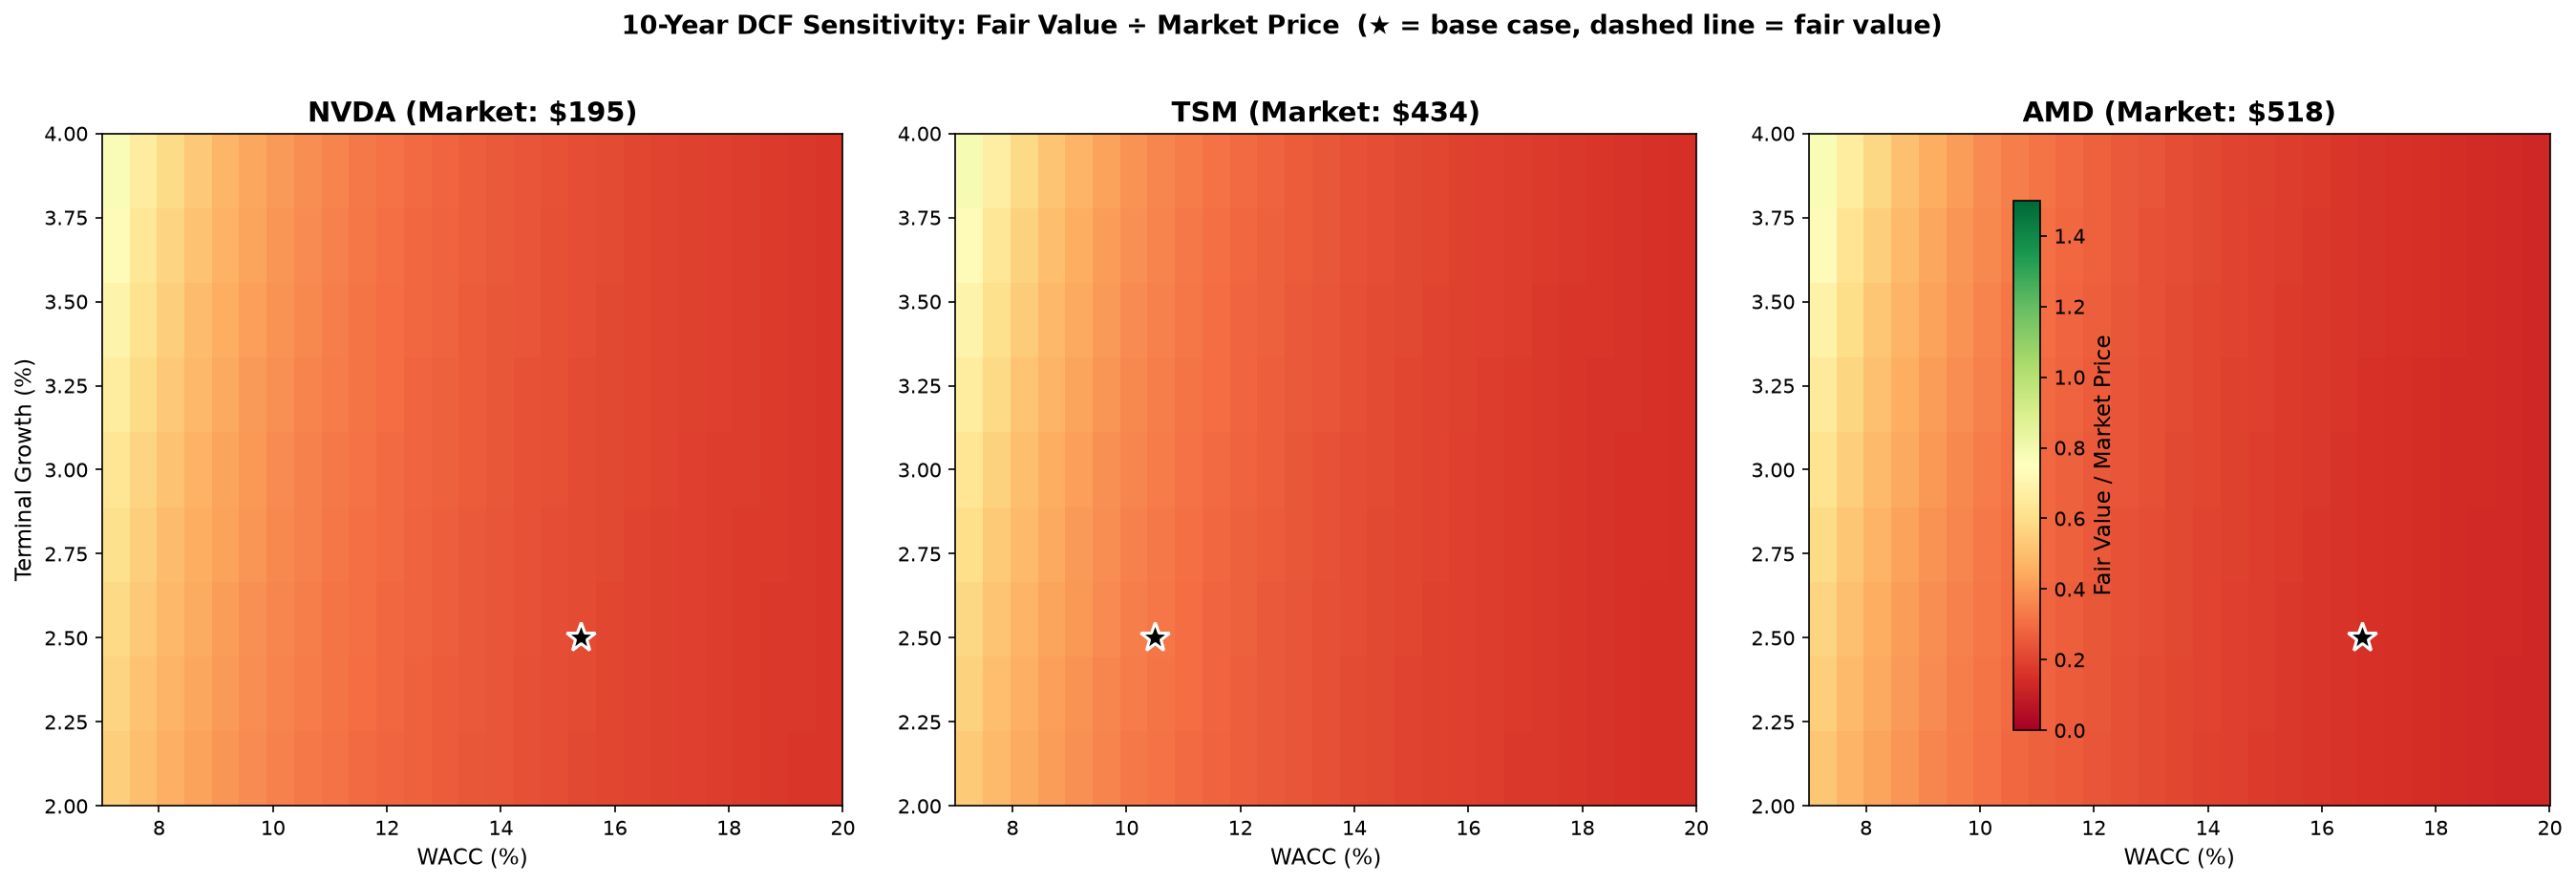
The base-case DCF produces fair values dramatically below market prices. Before concluding the market is irrational, we stress-test every assumption.
NVDA Sensitivity: WACC vs. Terminal Growth
| g=2.0% | g=2.5% | g=3.0% | g=3.5% | g=4.0% | |
|---|---|---|---|---|---|
| WACC 8% | $90 | $94 | $100 | $106 | $115 |
| WACC 9% | $78 | $81 | $84 | $88 | $93 |
| WACC 10% | $68 | $71 | $73 | $76 | $79 |
| WACC 12% | $55 | $57 | $58 | $59 | $61 |
| WACC 15.4% | $42 | $43 | $43 | $44 | $44 |
Even at the most optimistic corner — WACC 8% with 4% terminal growth — NVDA's fair value reaches $115, still 41% below the current $195.
TSM Sensitivity
| g=2.0% | g=2.5% | g=3.0% | g=3.5% | g=4.0% | |
|---|---|---|---|---|---|
| WACC 7% | $234 | $251 | $273 | $301 | $339 |
| WACC 8% | $194 | $205 | $218 | $234 | $254 |
| WACC 9% | $166 | $173 | $182 | $192 | $204 |
| WACC 11.2% | $125 | $129 | $133 | $137 | $142 |
TSM reaches $434 only under assumptions that are difficult to defend: WACC of 7% or terminal growth above 5%.
AMD Sensitivity
| g=2.0% | g=2.5% | g=3.0% | g=3.5% | g=4.0% | |
|---|---|---|---|---|---|
| WACC 8% | $223 | $236 | $253 | $273 | $297 |
| WACC 10% | $162 | $168 | $176 | $184 | $194 |
| WACC 12% | $126 | $129 | $133 | $137 | $142 |
| WACC 16.7% | $81 | $82 | $83 | $84 | $86 |
AMD at $518 is unattainable under any combination in this table. Even at WACC 8% and 4% terminal growth, fair value is $297 — 43% below market.
Reverse DCF: What Is the Market Pricing?
Rather than asking what our model says, we can invert: what revenue trajectory does the current price imply?
| Company | Current Price | Scenario | Implied Revenue Scale | Implied FY36 Revenue |
|---|---|---|---|---|
| NVDA | $195 | 12% WACC, g=2.5% | 3.5x our model | ~$1,750B |
| 10% WACC, g=3% | 2.7x our model | ~$1,350B | ||
| 8% WACC, g=3.5% | 1.8x our model | ~$920B | ||
| TSM | $434 | 12% WACC, g=2.5% | 3.8x our model | ~$985B |
| 10% WACC, g=3% | 2.9x our model | ~$735B | ||
| 8% WACC, g=3.5% | 1.9x our model | ~$481B | ||
| AMD | $518 | 12% WACC, g=2.5% | 4.1x our model | ~$473B |
| 10% WACC, g=3% | 3.0x our model | ~$346B | ||
| 8% WACC, g=3.5% | 1.9x our model | ~$222B |
For context: the AI accelerator TAM is projected to reach $540-670B by 2030-2035. NVDA at $195 implies Year-10 revenue of $920B even under the most optimistic discount rate — which would require NVDA to capture more than the entire projected TAM. AMD at $518 implies revenue of $222-473B, which would require capturing 20-40% of the AI accelerator market — a company that today holds 5-7%.
These are not forecasts. They are the market's embedded expectations. Any investor buying at these prices is making an implicit bet that these growth rates are achievable.
Market Approach: Forward Multiples
Why forward, not trailing? Investors buy future earnings, not past earnings. Trailing P/E is backward-looking and distorted by one-time charges, cyclical peaks, and accounting decisions. Forward P/E based on consensus EPS estimates captures what the market is actually pricing: the next 12 months of expected profitability.
Peer group selection. We use a diversified peer set spanning semiconductor sub-sectors:
| Peer | Sub-Sector | Why Included |
|---|---|---|
| AVGO (Broadcom) | Custom AI silicon, networking | Most diversified AI beneficiary outside NVDA |
| QCOM (Qualcomm) | Mobile, RF, automotive | Non-AI anchor: handset cycle exposure |
| TXN (Texas Instruments) | Analog, embedded | Mature cyclical: baseline for non-AI semis |
| ASML | EUV lithography monopoly | Upstream equipment: sole-source supplier |
| MU (Micron) | Memory (DRAM, HBM) | AI-adjacent: HBM is capacity-constrained |
| MRVL (Marvell) | Custom silicon, data center | Direct competitor in data center ASICs |
| INTC (Intel) | CPU, foundry | Legacy peer: turnaround story / cautionary tale |
| ARM | IP licensing | Software-like margins, pure AI exposure |
We exclude none of the major semiconductor names — the group spans designers, foundries, equipment makers, memory, and IP licensing. The spread captures the full valuation dispersion of the sector.
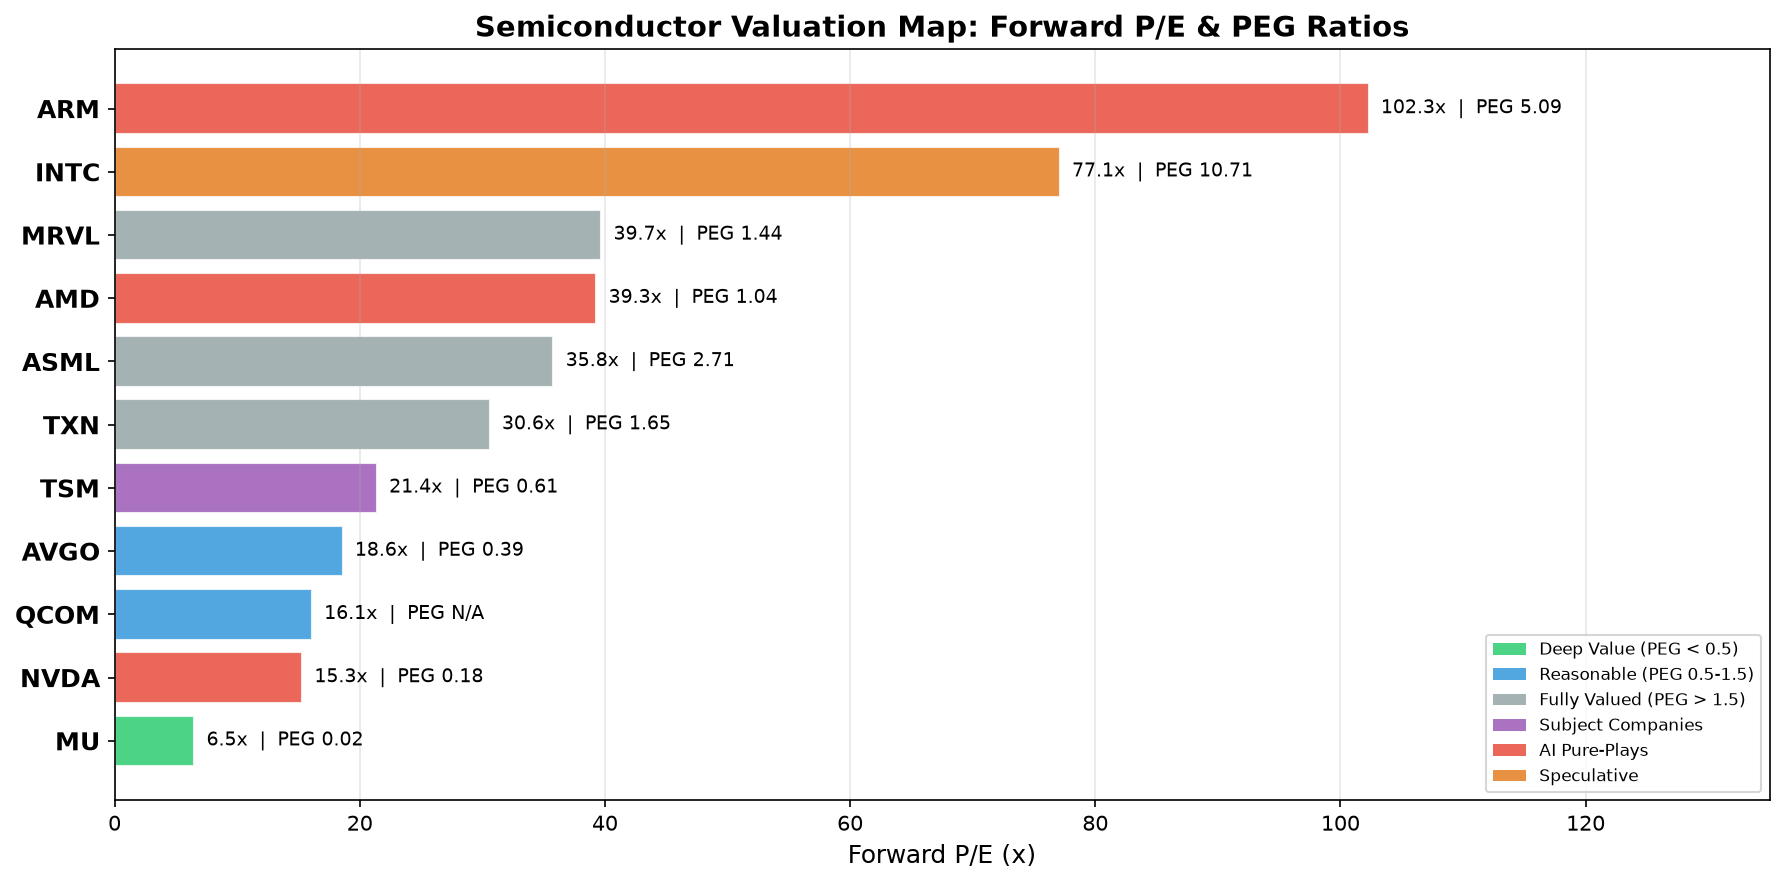
Current peer multiples (as of July 2, 2026):
| Company | Forward P/E | Fwd EPS | PEG | Rev Growth | EV/EBITDA |
|---|---|---|---|---|---|
| MU | 6.5x | $149.64 | 0.14 | +345.7% | 15.9x |
| NVDA | 15.3x | $12.76 | 0.60 | +85.2% | 28.2x |
| QCOM | 16.1x | $10.97 | 0.56 | -3.5% | 14.7x |
| AVGO | 18.6x | $19.40 | 0.41 | +47.9% | 41.8x |
| TSM | 21.4x | $20.29 | 1.37 | +35.1% | 5.5x |
| TXN | 30.6x | $9.57 | 1.40 | +18.6% | 31.8x |
| ASML | 35.8x | $49.40 | 2.65 | +13.2% | 40.5x |
| AMD | 39.3x | $13.18 | 1.24 | +37.8% | 112.5x |
| MRVL | 39.7x | $6.18 | 1.39 | +27.6% | 79.7x |
| INTC | 77.1x | $1.56 | 1.36 | +7.2% | 44.5x |
| ARM | 102.3x | $3.08 | 2.60 | +20.1% | 313.4x |
Sector median forward P/E (excluding outliers MU and ARM): ~30x
Growth-adjusted approach: Rather than applying a flat median multiple, we adjust for growth differential:
• NVDA: 25x forward P/E (premium to median for 85% revenue growth, but below current 15x because the market is already pricing significant deceleration). Implied price: 25 × $12.76 = $319
• TSM: 20x forward P/E (at median for a mature foundry with steady growth). Implied price: 20 × $20.29 = $406
• AMD: 24x forward P/E (above median for growth, below NVDA for profitability). Implied price: 24 × $13.18 = $316
The market approach tells a more forgiving story than the DCF — particularly for NVDA, which looks roughly fairly valued when applying growth-adjusted forward multiples. AMD remains expensive under any multiple framework because its current earnings base is so small relative to its market cap.
Blended Fair Value
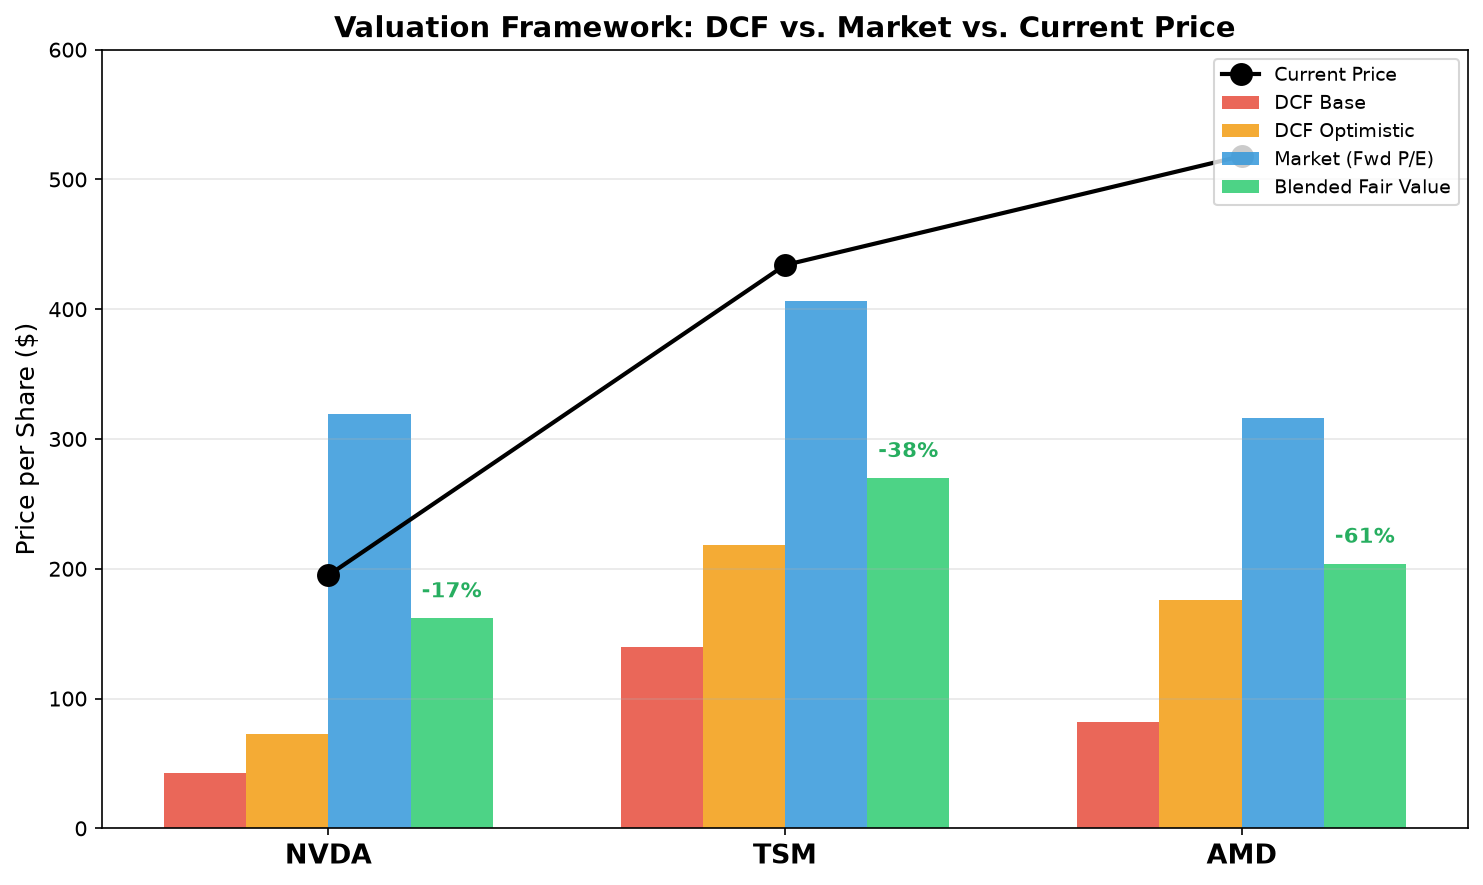
Weighting the income approach (60%) and market approach (40%):
| Company | DCF Base | DCF Optimistic | Market (Fwd P/E) | Blended Fair Value | Current Price | Upside/Downside |
|---|---|---|---|---|---|---|
| NVDA | $43 | $73 | $319 | $162 | $195 | −17% |
| TSM | $129 | $218 | $406 | $266 | $434 | −39% |
| AMD | $82 | $176 | $316 | $204 | $518 | −61% |
The blended fair value uses the average of DCF base and DCF optimistic for the income component (60% weight) and the growth-adjusted market approach (40% weight). The DCF optimistic case uses WACC of 10% with 3% terminal growth — a generous assumption implying semiconductor cyclicality is permanently reduced.
What Would Change Our Mind
The valuation gap between our model and market prices rests on three debatable assumptions:
1. WACC is too high. If semiconductor cyclicality has been structurally reduced by AI demand, a lower beta is justified. NVDA at a beta of 1.3 (instead of 2.2) would have a WACC of ~11%, lifting the DCF fair value from $43 to ~$58. Still below market, but the gap narrows. The evidence for this thesis: AI accelerator demand has not shown cyclicality yet, and hyperscaler capex commitments are multi-year. The evidence against: every prior semiconductor cycle looked different "this time" until it wasn't.
2. Revenue projections are too conservative. If the AI accelerator TAM grows to $800B rather than $540B by 2030, NVDA's revenue could reach $500B+ rather than our $436B. This would lift fair value by ~30-40%. But it requires AI adoption at a pace that exceeds even the most aggressive analyst projections.
3. The market approach should be weighted more heavily. If you believe forward P/E is the right framework and the sector median multiple of ~30x is appropriate, then NVDA at 15x forward earnings is genuinely cheap. The DCF's high WACC may be punishing the stock unfairly — penalizing NVDA for the sector's historical cyclicality even though AI demand has not yet shown a cycle. This is the strongest bull argument, and it's why we give 40% weight to the market approach rather than dismissing it.
The Honest Conclusion
Under any combination of assumptions that we can defend from historical data and current analyst consensus, these stocks are expensive. NVDA trades at a 17-78% premium to fair value depending on how generous you are with WACC and terminal growth. TSM is 39-60% above fair value. AMD is 61-75% above.
This does not mean they will fall tomorrow. Markets can price in optimism for years before reality catches up — the dot-com parallel that JPMorgan drew is relevant here, not because the macro setup is identical (it isn't), but because the mechanism is the same: when the entire investment community owns the same crowded trade and is using the same aggressive discount rates, the unwind is violent when it comes.
For professional investors, the actionable takeaways are:
NVDA: The best house in a rich neighborhood. Revenue growth and margins are real and extraordinary. The forward P/E of 15x with 85% revenue growth makes it the most defensible name on a multiples basis. The DCF says it's worth $43-73; the market approach says $319. The blended fair value of $162 suggests 17% downside, but that's the least bad outcome among the three. Position for the possibility that the market's lower WACC is correct — own it, but size for 30-40% drawdown if the next semiconductor cycle arrives and the beta reasserts itself.
TSM: The most defensible on a relative basis. Its WACC is genuinely lower (less cyclical, foundry duopoly with Samsung), and the forward P/E of 21x is reasonable for 35% revenue growth. The CapEx burden is real but it is also the moat — no competitor can replicate TSMC's manufacturing lead without spending $200B+. Buy on weakness below $350.
AMD: The most overvalued relative to fundamentals. The DCF and reverse DCF both show that the current price requires revenue growth rates that are mathematically implausible given the TAM constraints. Even the market approach, which is more forgiving, suggests AMD is 40%+ overvalued at $518 against a blended fair value of $204. The thesis depends on AMD capturing 15%+ of the AI accelerator market and expanding operating margins to 30%+ simultaneously — both possible, but pricing both as near-certainties at these levels is speculative.
The July correction has not changed any of this. A 14% pullback after an 87% surge returns valuations to where they were two weeks ago — still stretched. The real test comes with TSMC earnings on July 17. If TSMC confirms the AI demand trajectory and raises guidance, the market's lower-WACC thesis gets a data point. If guidance disappoints, the high-beta reasserts itself with a vengeance.
The Model
The full DCF model — all assumptions, all line items, all three companies, all 10 years — is published here as a downloadable CSV. Every input can be challenged, every formula can be reverse-engineered, every assumption can be stress-tested. If you disagree with our capex trajectory, change it. If you think the terminal growth rate should be 3.5%, change it. The model is transparent by design.
The beta calculations use 5-year monthly returns (61 observations, July 2021 – July 2026) regressed against three benchmarks: S&P 500 (SPY), Nasdaq 100 (QQQ), and PHLX Semiconductor (SOXX). Raw return data is from yfinance.
Methodology notes: Financial data from company filings via yfinance. Beta is 5-year monthly regression vs. S&P 500 (base case), Nasdaq 100, and PHLX Semiconductor. WACC uses CAPM with Damodaran's ERP estimate (5.0%). Revenue projections are top-down from TAM analysis cross-referenced with multiple research firms. Forward EPS from consensus estimates via yfinance. Peer group selected to span semiconductor sub-sectors (design, foundry, equipment, memory, IP licensing). All projections are the author's and do not constitute investment advice.